Maven Toys Interactive Dashboar
This project provides stakeholders with insights regarding sales and inventory data.
BACKGROUND
For this project I decided to utilize a dataset from Maven Analytics that would explore sales and inventory data for a fictious toy company.
THE DATA
The data consisted of four tables:
-
Sales
-
Stores
-
Products
-
Inventory
I explored the data in Excel and utilized VLOOKUPS to add columns to the Sales and Inventory tables, since these are the tables I would use once I moved the data into Tableau.
THE ASK:
Once the data was exactly as I wanted it to be, I uploaded the tables to Tableau to discover answers to the following questions:
-
Which product categories drive the biggest profits? Is this the same across store locations?
-
Can you find any seasonal trends or patterns in the sales data?
-
Are sales being lost with out-of-stock products at certain locations?
-
How much money is tied up in inventory at the toy stores? How long will it last?
MY FINDINGS:
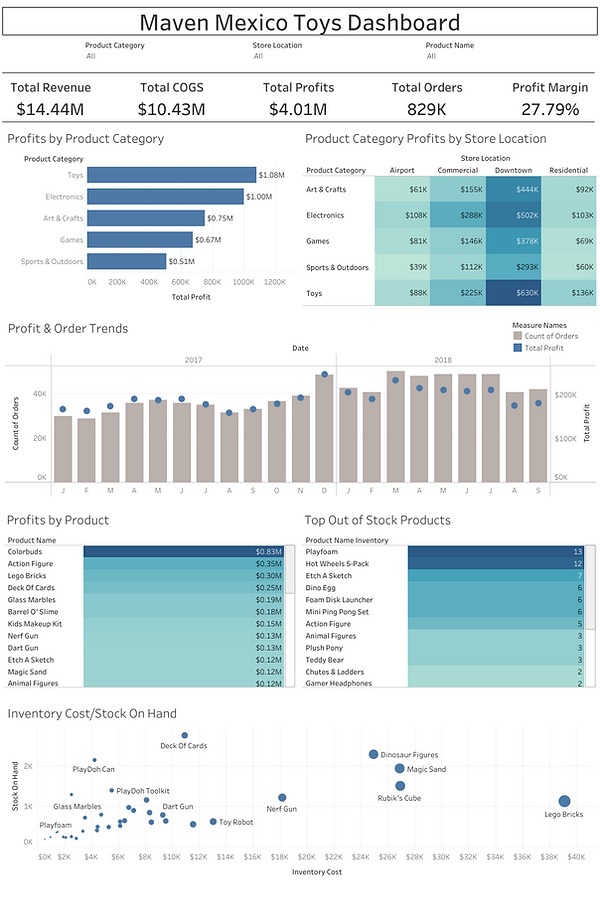
Toys is the top product category bringing in the most profits. This trend holds true for Downtown and Residential store locations. Electronics brings in the most profits for Airport and Commercial store locations.
Arts & Crafts shows a steady increase in profits and orders from January 2017, while Electronics showed a steady decline. Orders and profits for Games peaked in December 2017. The best season for Sports & Outdoors is Spring and Summer. Efforts can be put into continuing on the momentum that Arts & Crafts is experiencing, while targeting other product categories during times of the year when they see the most orders & profits.
Lego Bricks has the highest inventory cost. Best-selling items like Action Figure and Etch A Sketch are some of the top Out of Stock items based on Inventory data for October 2018. Based on historical data, inventory of Lego Brick will last for two weeks. To increase revenue and profits, the company should look into ensuring that best-selling items are in stock at store locations.
The dashboard can be filtered by Product Category, Store Location, and Product Name for interactivity.
Click here to view and interact with the dashboard.