PPE and Ventilator Supply Analysis
This project provides stakeholders with insights regarding PPE and Ventilator supply levels at hospitals and clinics in the United States.
BACKGROUND
For this project I wanted to explore supply levels of Personal Protective Equpment (PPE) and Ventilators.
*This project is part of a Coursera Guided Project. The health company is fictitious, and this project is for educational purposes.
THE DATA
The data source was the website covidtracking.com/api. I found the CSV file for Current Values for All States and downloaded it in Excel. Here's the data once it was uploaded in Excel.
I added an additional tab in Excel, which is where I would do my data processing. Columns that weren't necessary for what I was looking to discover were eliminated. I added a region column from ad additional CSV file that was provided. I added a column named ventsNeeded, which would calculate the amount of ventilators needed by states.
To determine the number of ventilators needed, I looked at the number of patients in the ICU and subtracted that value from the number of patents currently on a ventilator. The thought process being that patients in the ICU would most likely need to be on a ventilator. The resulting value is an educated guess based on the assumption that if a patient has been placed in the ICU, then they are in a critical condition that may require a ventilator. If the resulting value for ventsNeeded is negative, then it is considered a possible surplus based on the assumption that there are no patients in the ICU and a limited number of patients currently on a ventilator. This would imply that the state has enough ventilators since they have no ICU patients.
For the needs of PPE, we can look at the number of patients that are currently hospitalized. We can infer that those hospitals and clinics with the most patients in this category will have a greater need for PPE.
Here's what the spreadsheet looked like after I made all the changes:
THE ASK:
As the analyst, I was tasked with providing company Executives and State Health Officials with the states who showed the highest need of PPE and ventilators. I uploaded my modified spreadsheet into Tableau to start putting together some visuals that would help stakeholders gain an understanding of which states had the highest need for PPE and ventilators.
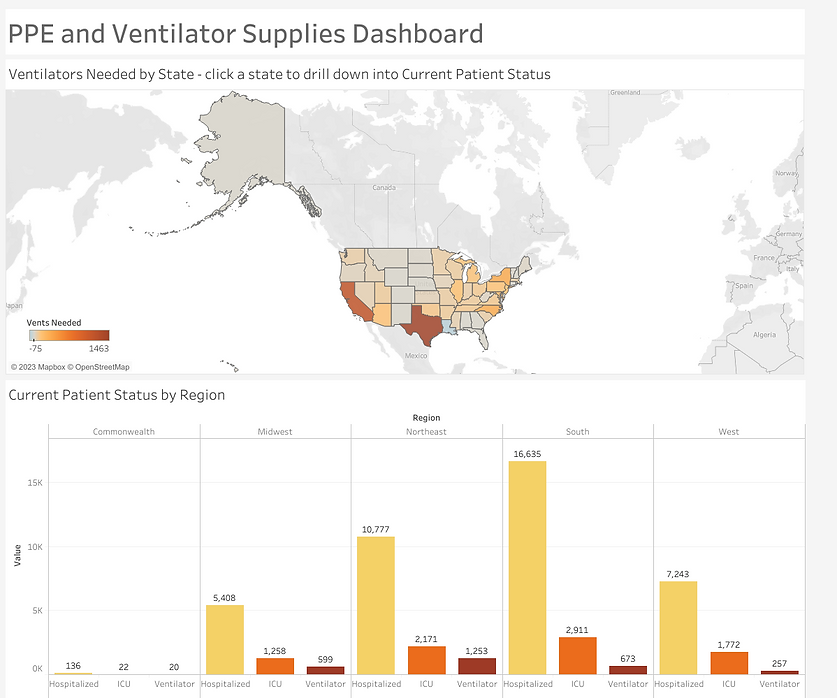
MY FINDINGS:
Texas leads as the state needing the most ventilators. Followed by California, New York, North Carolina, and Maryland.
New York leads as the state with the most patients currently in the hospital. Followed by Texas, California, Florida, and Georgia. Since these states have the most patients in a hospital, they will be considered states with the highest need for PPE.
The dashboard is interactive. States can be clicked on so stakeholders can drill down to view measures of Ventilators Needed, Patients Hospitalized, Patients in ICU, and Patients on a Ventilator.
Click here to view and interact with the dashboard.